Bergstrom Market Perspective – Member Survey Results
Thank you for responding to our survey last quarter. Each quarter we hope to collect our members’ views on the current market conditions. Most interesting will be the trends that reveal themselves over time. The next survey will arrive in a week or so, giving us the first two points in the market view as our members see it. Please help make this meaningful with your input.
In addition to the categorical responses to specific questions, many of you offered input through the open question at the end. We took notice of your comments about the “impact of COVID,” “difficulty to generalize,” “divided RE market,” the existence of “ugly deals,” and the “bi-furcated … market.” These comments help us interpret the results. We also received ideas for new analysis on “migration to the state” and the “disparity between the availability of permanent debt and construction debt.” We are focusing on these ideas and hope to deliver reports in the future. Please continue to share your thoughts to improve our interpretation and point us in new directions.
As we develop our process, we plan to present comprehensive survey results on our website (yet to be developed) and summary results in our quarterly document. You should see headlines, as we select them, in the materials that we deliver to you and be able to follow a link to more complete results if you need more detail. The first quarterly comparison will appear in our March Quarterly Document.
With responses from a single point in time, no pattern exists but the following charts offer the initial perspective and the starting point for our future analysis. Keep in mind that these responses were given in early November 2020; a very uncertain time in the markets due to COVID 19.
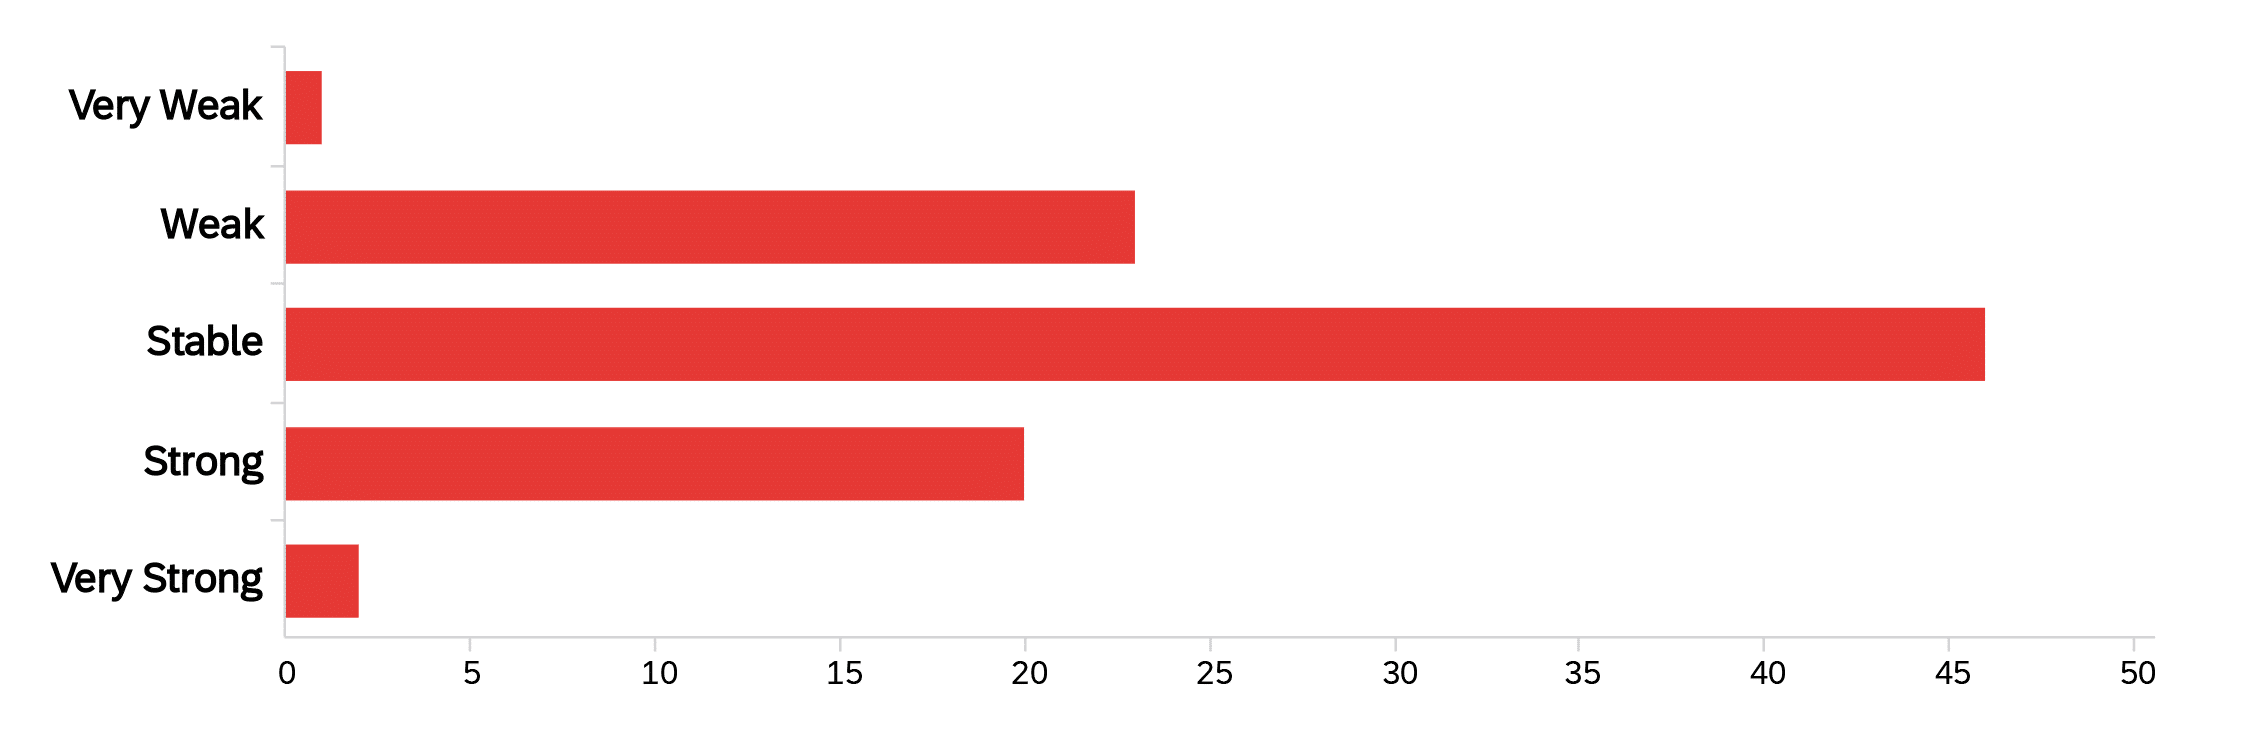
Given the environment, the response to the most general question is remarkably symmetric. Almost half of our members view the market as Stable with equal numbers suggesting Strong or Weak. This likely reflects the specific sector of each respondent – i.e. Industrial vs Retail.
What is your current overall outlook for your real estate market?
Even though an equal number of members think the market is weak compared to strong, two-thirds of the group expects to conduct the same amount or more business than they did over the previous year. Interestingly, the high level of uncertainty does not dampen optimism about the activity in the market. Furthermore, 60% of the group expects to hire new staff over the coming year and 27% expect the number to be greater than over the past year.
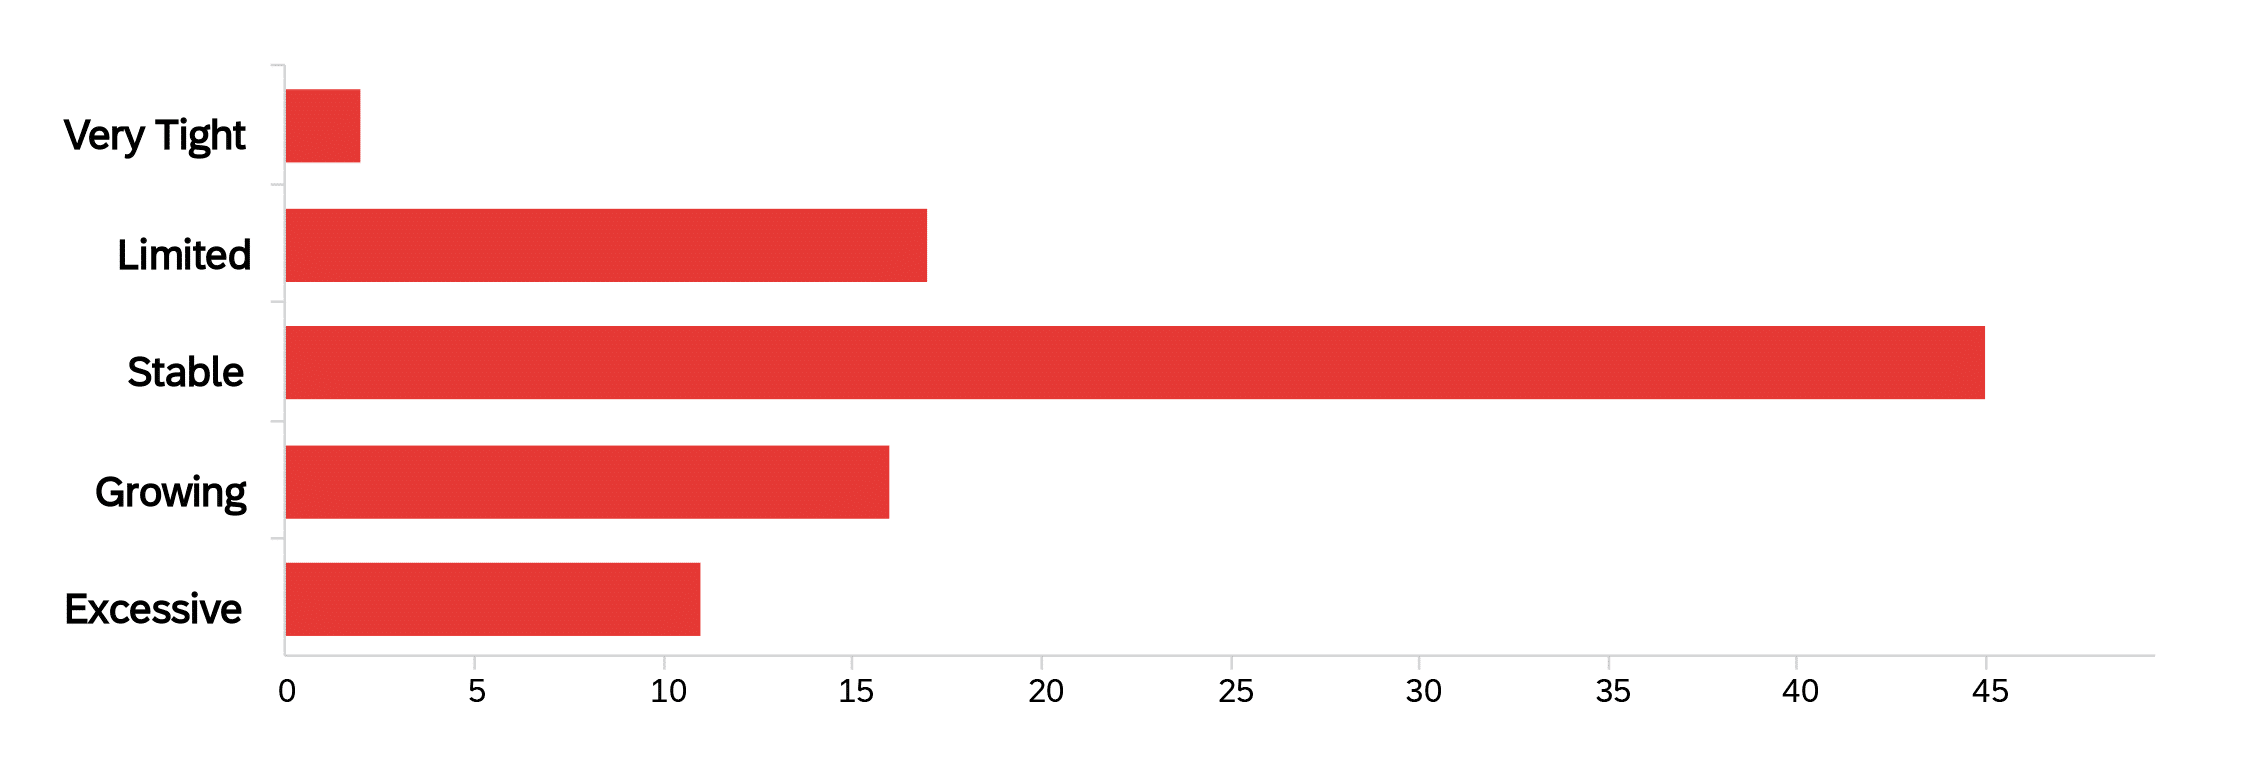
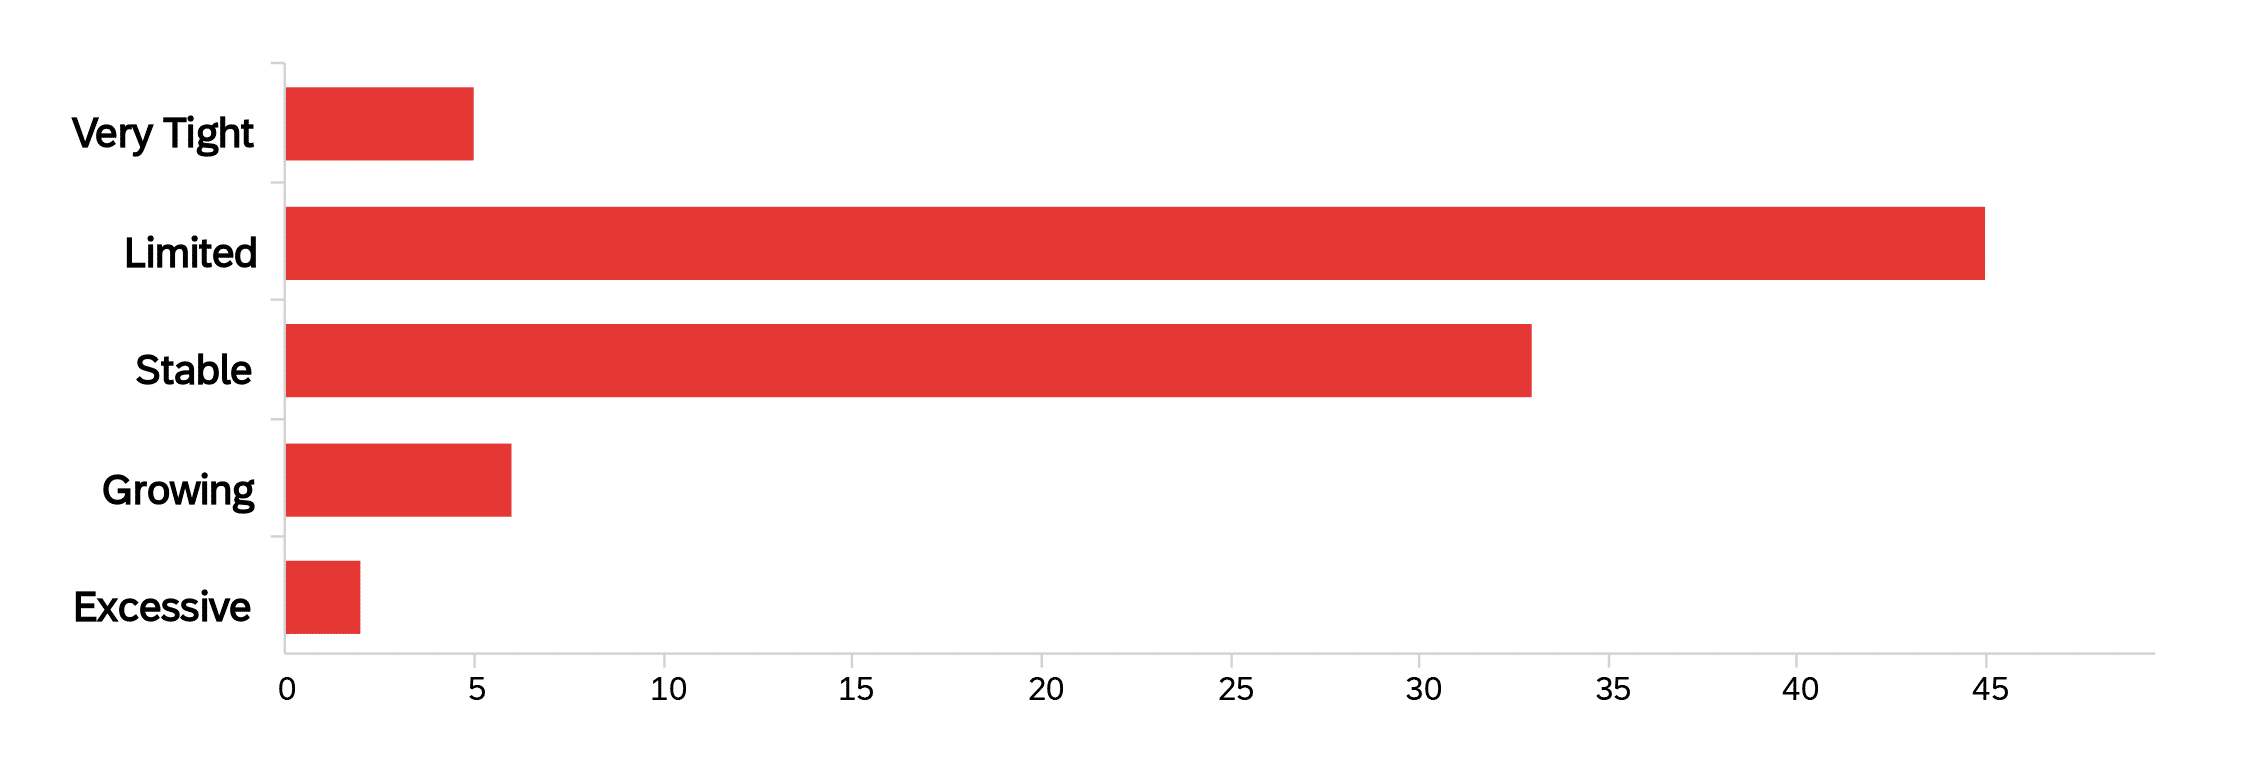
The comparison between the availability of Equity and Debt is interesting to view side-by-side. Most see the equity side as Stable with a slight skew toward Growing and Excessive. At the same time, Limited is the most common response to the Debt question. This combination could coincide with conditions that give buyers optimism about near-term pricing and long-term opportunities while making lenders nervous about the current uncertainty. The patterns produced in these areas will be interesting to watch as the market recovers from the COVID punch.
The availability of Equity capital is…
The availability of debt capital is…
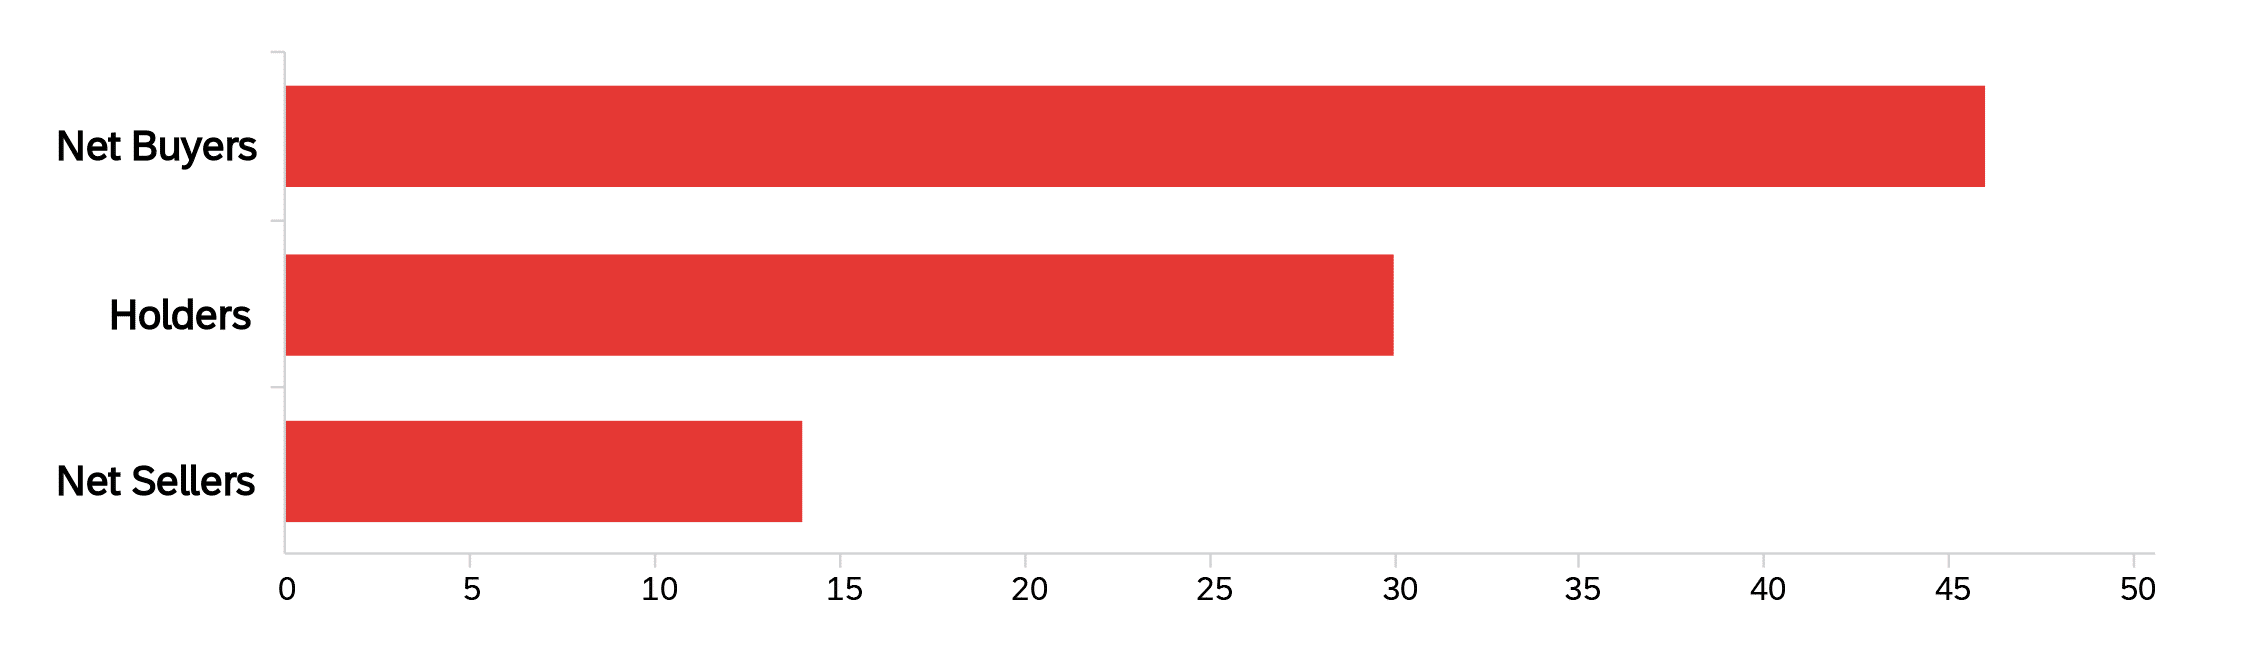
Market shocks increase the uncertainty that may cause current owners anxiety but may also create an opportunity for new investors. Only a small percentage of our members (16%) believe that the coming year will favor sellers. Rather, the view is not only Hold what you have but Buy more.
Over the coming year, smart investors will be …
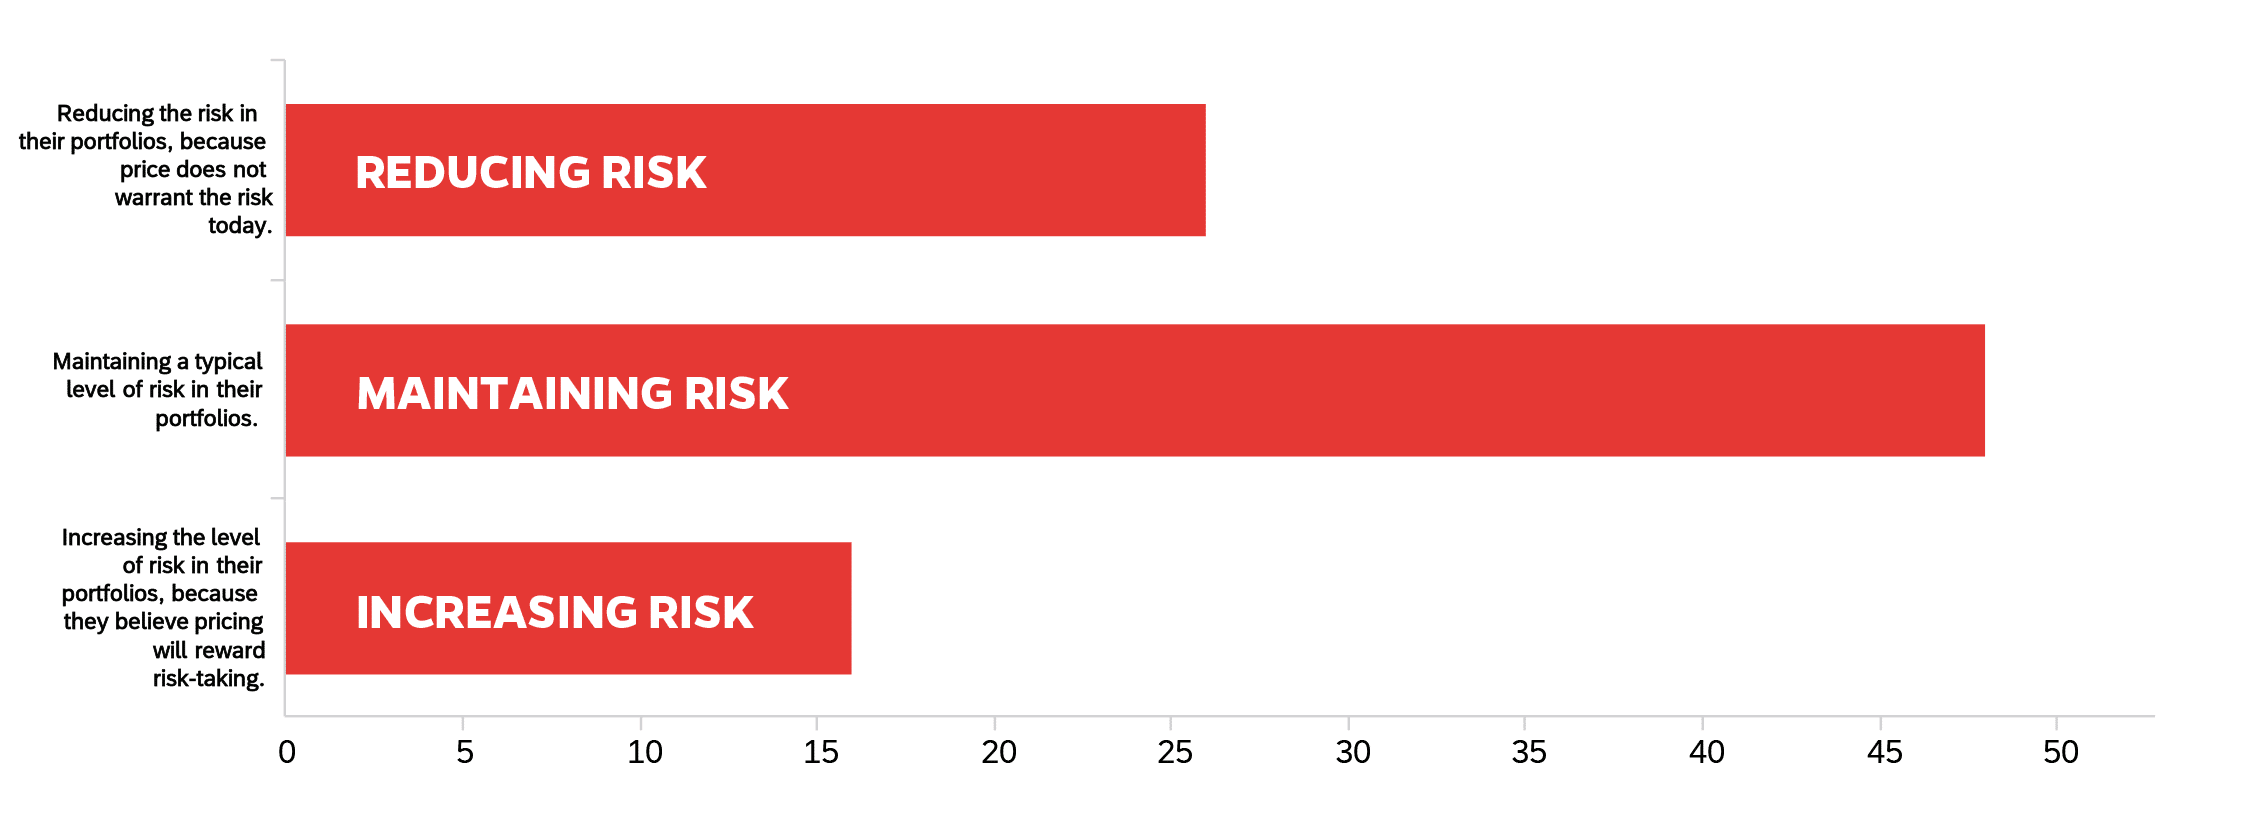
While we collectively believe that this is a buying opportunity, there is little enthusiasm for increasing the risk in portfolios. One interpretation is that we expect favorable pricing for quality stabilized assets that are producing income but are concerned about time for recovery and believe that accepting financial instability is a mistake. Of course, there are other scenarios that will produce this result.
Today, smart investors are …
The group almost unanimously agrees that today’s opportunities are in the Industrial (46%) and Multifamily (44%) sectors. Interestingly, the response for multifamily is almost the same as it is for industrial. It is an even split between the two sectors. On the other side, Retail (56%) is clearly the sector with the poorest expectations followed at some distance by Office (37%).
The responses by sector are very reserved with no sector reaching 6 on the 1-10 scale. Thus, the expectations by sector are Stable to Negative. Market-Rate Apartments received the highest score of 5.9 followed by Senior Housing (5.0), Suburban Office (4.5), and Anchored Retail Centers (4.4). Hotels and Malls, both below 2.0, received the weakest ratings.
There is a bit more confidence and little variation in the City results. All scores are between 5.5 and 7.0 on our 10-point scale. In such a tight range, it is unfair to really distinguish between the markets. The result is that the majority of members view all of the Florida markets as Stable to slightly positive. In ranking absolute scores, Tampa/St. Pete (7.0) and Bradenton/Sarasota (6.4) have higher scores and Ft. Myers (5.5) and Orlando (5.9) have lower scores.
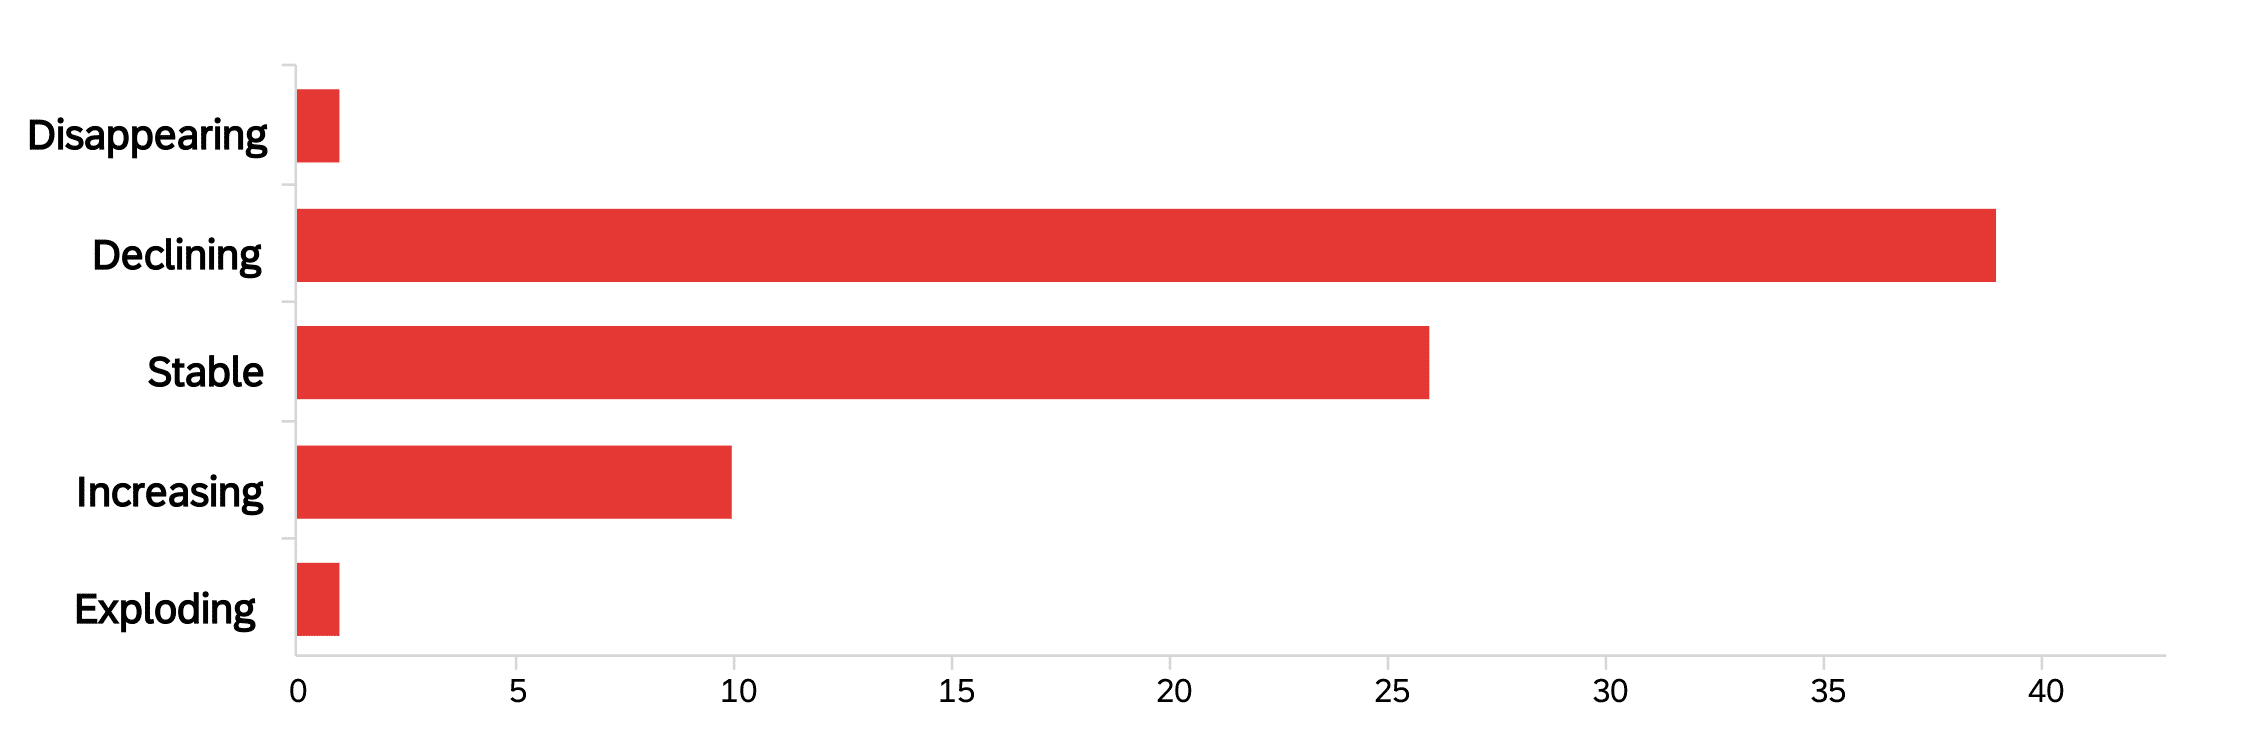
Finally, the overall expectation is that tenant demand is Stable to Declining. About 14% of the group see some form of rising demand but the larger portion expect stable or slightly declining demand. This is consistent with the notion that leases are being executed but some are with “ugly” terms. This result is most likely sector dependent, which is a point that we will try to filter out in the future. The Industrial sector was very strong pre-pandemic so the impact may have slowed the sector to lower but still positive incremental tenant demand. Retail demonstrated falling demand before the virus issues entered the environment. The following chart may be describing a parallel “step down” by all sectors. It does not indicate a deep loss but rather a current drag on growth.
Tenant demand for commercial space throughout Florida is …