


Bergstrom Real Estate Perspective – Initiating a Trend
A series of three quarterly results starts to establish a trend. The first of the Bergstrom Center’s Member Perspective Surveys was conducted during the fourth quarter of 2020. This was a time when the “two week” economic shut-down was in its eighth month and the Covid vaccine was yet to be released. Despite the high degree of economic uncertainty, our collective view on the commercial real estate market was surprisingly optimistic.
After the first of the year, the second survey results indicated a gradual step up from cautiously optimistic to increasingly confident. The results at the beginning of 2021 indicated that the results from the end of 2020 were indeed intended to show a bright outlook despite the current challenges. The second survey solidified the results of the first and set our baseline.
Now we share the third set of results which refer to the group’s second quarter 2021 perspective. Again, responses indicate an improving real estate outlook over the past nine months. The range of responses seems fairly wide which we might expect given the differing impact of the Covid virus on the different segments of the real estate market. However, in general we will see that the entire mood is improving.
Responses from each of the three surveys for a selection of the questions follows. Each column of each chart shows the percentage of respondents who gave a specific answer. The text associated with each chart describes some of our observations and suggests some points on the chart that warrant focus.
What is your current overall outlook for your real estate market?
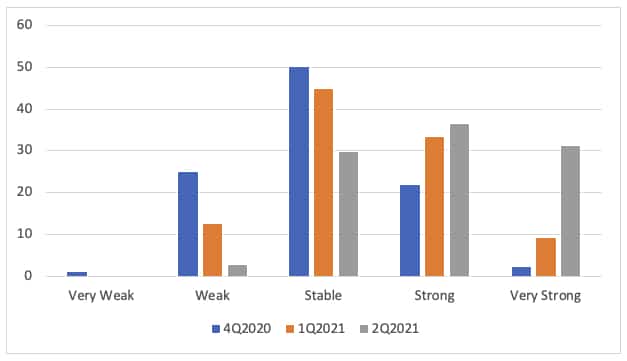
Figure 1
Focusing exclusively on the 4Q columns in this first chart (the first column in each grouping), it is clear that the outlook at that time was primarily Stable with a similar percentage of respondents on either side of that response. During 1Q, Stable was still the most common response but the bulk of the other answers moved to the Strong and Very Strong side of the chart. The weight of response again moved significantly to the right of the chart in the 2Q survey. Now Strong is the most frequently given response and as many respondents answered Very Strong as they did Stable. Only a very low percentage of our responses were below Stable.
Compared to the most recent year, do you expect to do more or less business in the coming year?
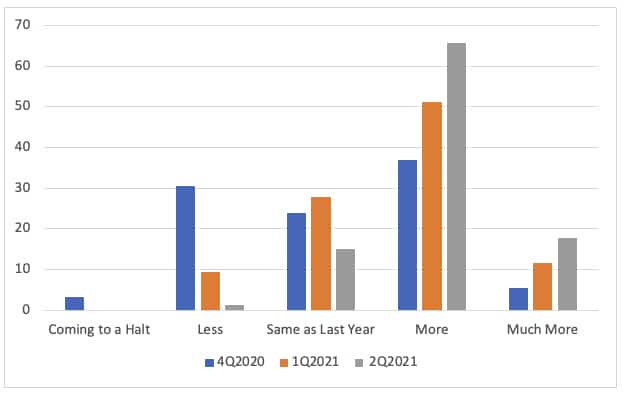
Figure 2
Consistent with the Outlook response, expectations for the coming year’s business is significantly brighter than it was two quarters prior. At the end of a rough 2020 (again the first column in each grouping), real estate professionals viewed 2021 with cautious optimism. About a third of the respondents expected to see Less business, a third expected business to be the Same as Last Year, and a third expected to see More business. This perspective improved significantly during the first quarter and continued improving into the second quarter.
Notice that the 2Q2021 columns are heavily tilted toward the More future business side of the chart compared to the 4Q2020 columns. The consistently improving expectations for business activity from 4Q to 1Q to 2Q are dramatic. Many factors may influence this result but one view is that the real estate business (on average) during 2020 was not as weak as many had feared. Of course, this depends on the specific sector as hospitality suffered terribly but industrial powered through. Coming from that position in 4Q, many may have anticipated a delayed fall in the coming year. However, as we move through 2021 with a vaccine and restarting most activities everyone expects the coming year’s business to grow.
The next two charts reveal our participants’ suggested actions for investors. Even though not all of our respondents are directly investing in commercial real estate, all are activity participating in the real estate investment market. Thus, we want everyone’s view of the market opportunities and risks.
The first chart indicates our collective view on the opportunity in the market. A very interesting pattern arises among the three quarters. Notice that the 4Q2020 columns suggest that the end of the year might have been a buying opportunity. Despite the balanced Outlook and Expectation for Business Growth that we saw in the previous charts for that timeframe, more people thought that investors should be Net Buyers than Net Sellers. Perhaps they felt as if the pricing at that time more than compensated for the flat expectations. Interestingly, both of the 2021 results are much more even between Sell, Buy, and Hold.
Given the improving Outlook over each quarter, we must consider that this shift from Net Buyer to Net Seller is an indication of higher expected current prices that offset the expected growth. Perhaps the market did not discount prices as much as was expected six months earlier.
Over the coming year, smart investors will be …
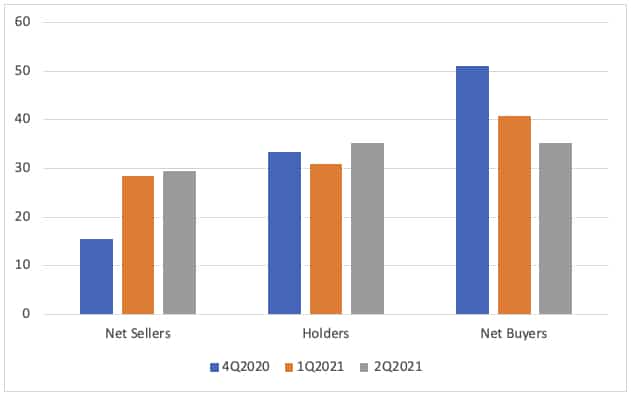
Figure 3
Today, smart investors are …
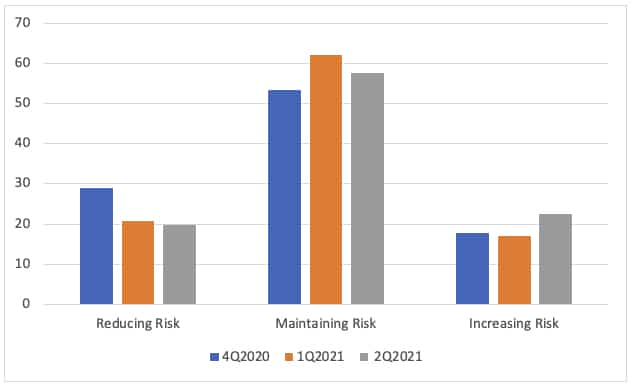
Figure 4
The second chart in this opportunity and risk series indicates that our perspective on risk is basically unchanged over the past few quarters. Combined with the Buyers/Sellers chart above, we might accept confirmation that the market is viewed with typical risk and fair prices. Thus, the 2Q2021 columns in both charts are well balanced. Maintain Risk and continue transacting seems to be the message.
Tenant demand for commercial space throughout Florida is …
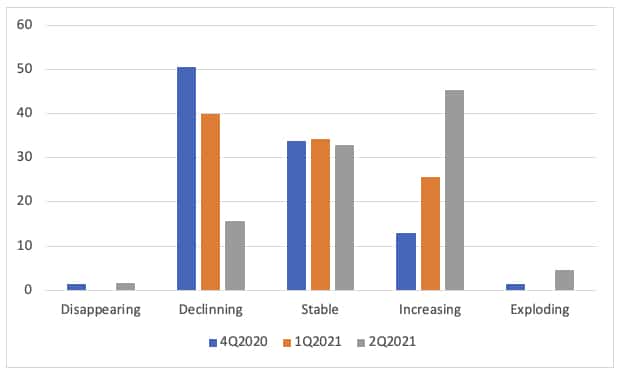
Figure 5
The final chart selected from the 2Q2021 Survey is focused on tenant demand in Florida. Similar to the outlook response, perspectives on demand changed quite a bit over the past few quarters. About a third of the group view tenant demand as Stable through all time periods. However, from 4Q to 2Q perception swung from primarily Declining to primarily Increasing. The smooth nature by which this response transitions from decline to increase boosts our confidence that this measure accurately captures the changing perspective.

