Initial Impact of COVID-19 on Commercial Real Estate Operations
It has been eight months since we learned about this virus and five months since the world started collectively reacting to it. In terms of real estate investment, this is a very short time. Five months is also too short to measure, collect and analyze the entire impact of any event on real estate operations. However, initial measures reveal that the impact is significant.

Initial estimates of second quarter US GDP suggest that the economy operated at a level 9.5% below that of first quarter. Second quarter NCREIF1 returns reveal that ODCE2 values fell by an average of 2.5%. A NCREIF survey of July collections reveals the operational impact of the changing environment, as apartment, industrial and office collections were 91% or 92% of invoiced rents, and retail collections were just 61% of invoiced rents.
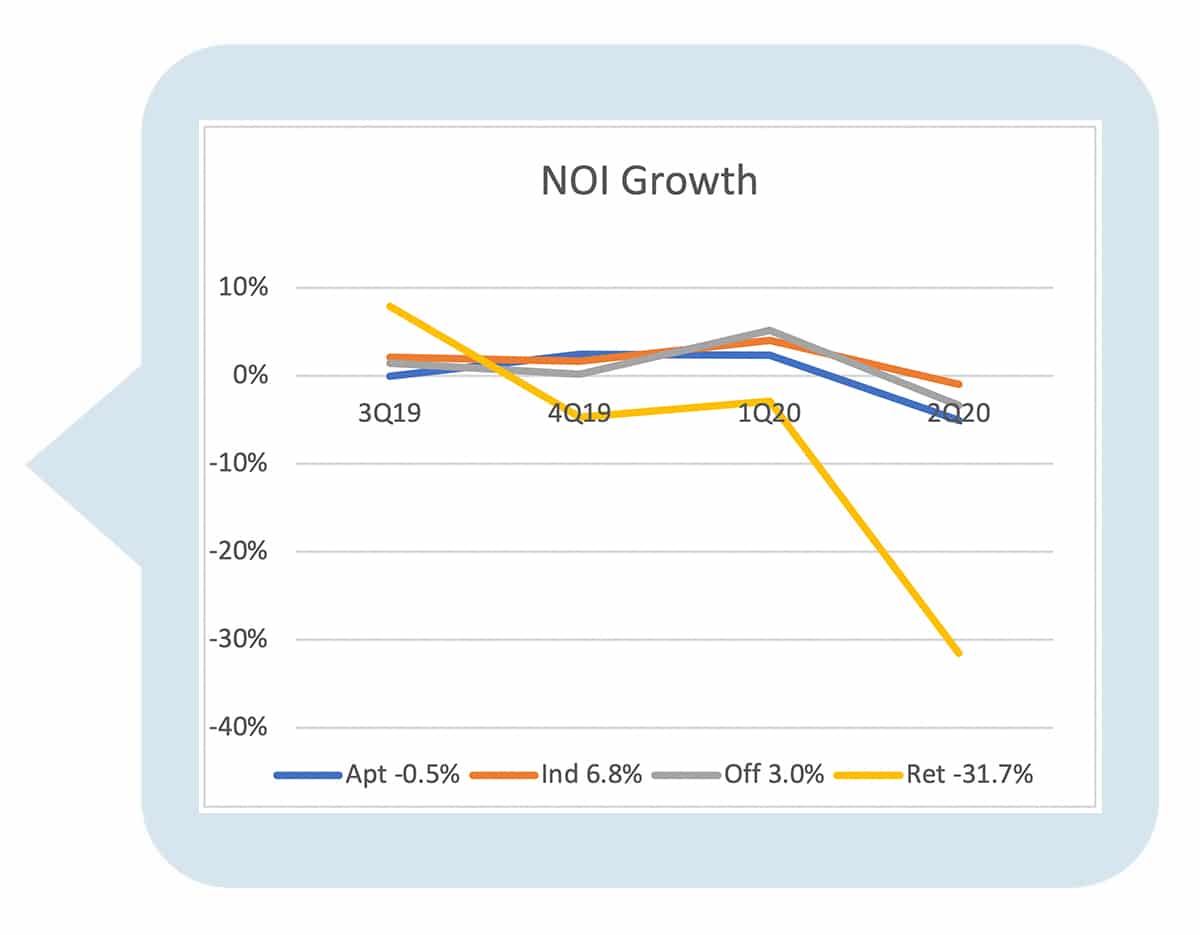
Prior to any mention of a pandemic, specifically calendar year 2019, commercial real estate values were growing at the modest but reasonable rate of 1.8%. Uncertainty seemed to enter private real estate valuations during the first quarter, as values fell slightly with -39 bps appreciation3. By the second quarter, the COVID-19 effect was undeniable, albeit the overall magnitude of the impact is yet to be determined. The following charts reveal the consistency of direction that the market has taken across geography and the variance of the impact across property types.
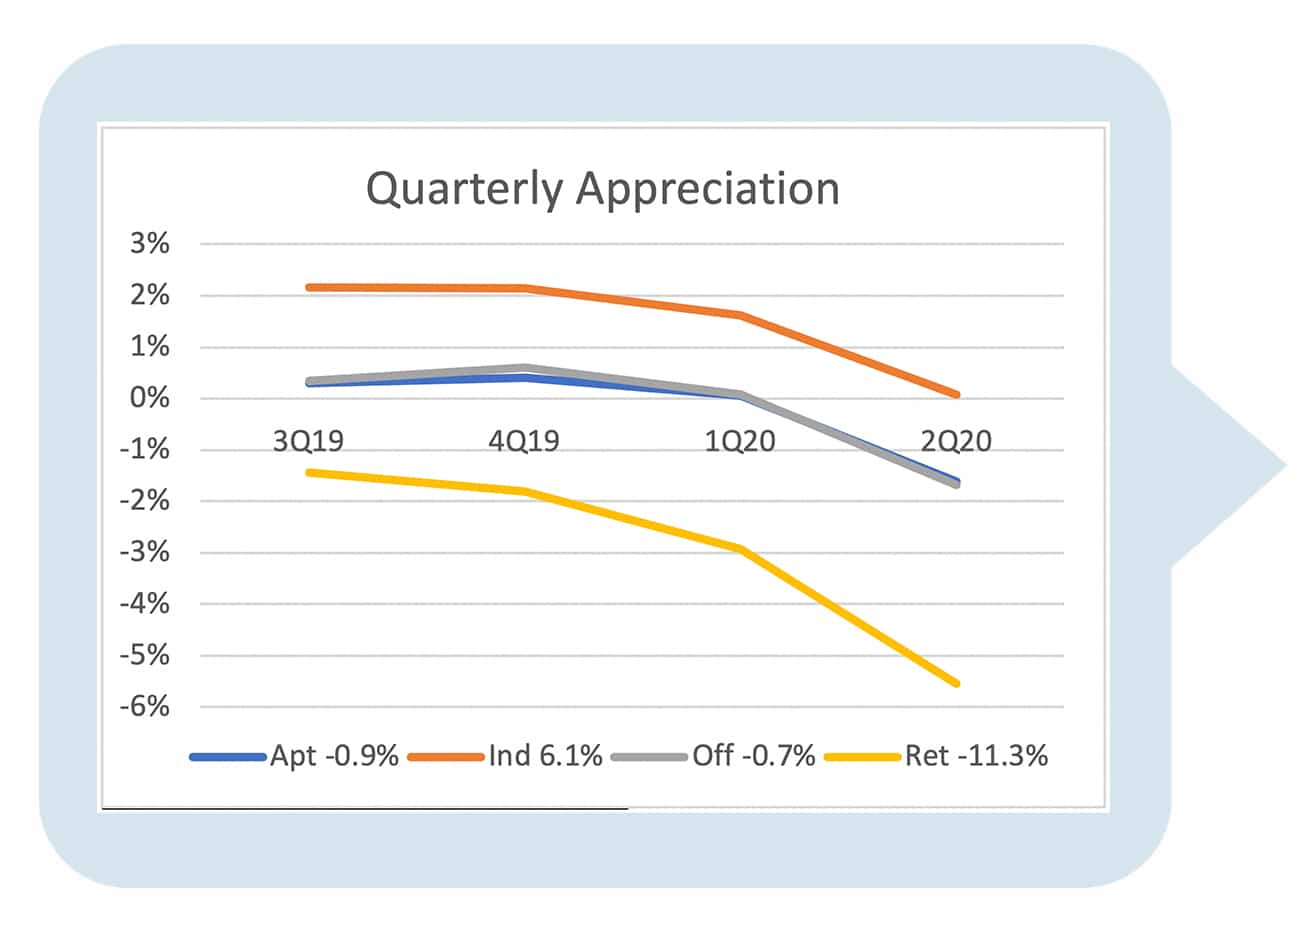
It should be noted that these are private real estate values measured by appraisal. When a market shock occurs, publicly traded REIT values react with a dramatic, and quick, price adjustment, often oscillating to a stabilized value as information becomes clearer. Private real estate typically responds with a loss of liquidity and a rather slow value change that usually trends toward a stabilized value. The RCA data in the table above show that liquidity fell by 68% during the quarter, confirming this pattern. Thus, such a significant drop in value is quite significant in the private market.
The beauty of real estate is that each asset is unique. Thus, there is wide variation in the performance of real assets, dictated by specific markets and individual characteristics – not to mention individual operations. The information above does not tell the story of any single asset but rather describes the collective environment in which a large sample of assets operate. It may provide some context for the influence that the COVID-19 virus has had on your assets.
1National Council of Real Estate Investment Fiduciaries – A non-profit association of private institutional real estate investors and advisors that was established in 1978.
2 ODCE is the Open-End Diversified Core Equity index produced by NCREIF. It reflects the results of 25 private institutional funds representing $206 billion of commercial property value.
3According to the NCREIF Property Index.